
Proportionality and linear functions
I- Recognizing proportionality
II- Graphical representation of proportionality
Exemple :
– We Consider the following table :
$$
\begin{array}{|l|c|c|c|}
\hline \text { Number of kg of apples } & 0,5 & 1 & 1.5 \\
\hline \text { Price(dh) } & 1,5 & 3 & 4.5 \\
\hline
\end{array}
$$
– We have : $\frac{1,5}{0,5}=\frac{3}{1}=\frac{4,5}{1,5}=3$
– So, this table represents a situation of proportionality
– In an orthogonal plan ( $0 ; \mathrm{I}$; J), let’s represent the points: $\mathrm{A}(0.5 ; 1.5) ; \mathrm{B}(1 ;$ 3) ; C(1.5; 4.5)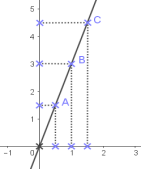
-Note that all points: $A$; $B$ and $C$ are aligned with the origin of the orthogonal plan ( $O ; I ; J$ ),
– We say : the figure represents a situation of proportionality.
Exemple :
– We Consider the following table :
$$
\begin{array}{|l|c|c|c|}
\hline \text { Nbre of kg of potatos } & 1 & 3 & 4 \\
\hline \text { The price(dh) } & 2 & 6 & 7 \\
\hline
\end{array}
$$
– We have : $\frac{2}{1}=1$ and $\frac{6}{3}=2$ and $\frac{7}{4}=1.75$
– So, this table doesn’t represent a situation of proportionality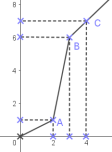
– In an orthogonal plan ( $O ; I ; J)$, let’s represent the points : $A(1 ; 2)$; $\mathrm{B}(2 ; 3) ; \mathrm{C}(3 ; 6)$
– Note that all points: A; B and C aren’t aligned with the origin of the orthogonal plan ( $\mathrm{O} ; \mathrm{I} ; \mathrm{J}$ ),
– We say : the figure doesn’t represent a situation of proportionality.
III- The fourth proportional
Définition :
▶ $\mathbf{b}$; b; c and $\mathbf{x}$ are non-null integers
▶ x is the fourth proportional of the numbers a ; b and c means :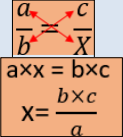
IV- Uniform Movement/ Uniform motion
V- The scale
Exemple :
– We Consider the following scale :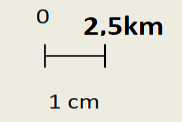
– 1 cm on this plan represents 2.5 km in reality,
– 1 cm on this plan represents 250000 cm in reality.
– We say : $\underline{\text { The scale }}=\frac{1}{250000}$
VI- The percentage
VII- Linear function
Exemple :
– We consider the following proportionality table
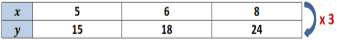
– The coefficient of proportionality is the number $\mathbf{3}$
– So : $\mathbf{y = 3} \times \mathbf{x}$
– The relation between the number $\mathbf{x}$ and its image $\mathbf{y}$ is called the linear function $f$
– We write : $\mathbf{f}(\mathbf{x})=\mathbf{3} \times \mathbf{x}$ or $\mathbf{f}(\mathbf{x})=\mathbf{y}$
– the number $\mathbf{3}$ is the coefficient of the linear function $\mathbf{f}$
– The number $3 \times x$ is the image of $x$ by the linear function $f$
Exemple :
– We consider the following linear function $f$ such as: $f(x)=-3 x$
– We have:
$$
\begin{array}{|c|c|c|c|}
\hline x & 1 & 0 & -1 \\
\hline f(x) & -3 & 0 & 3 \\
\hline
\end{array}
$$
– Let’s plot the points $\mathrm{A}(-1 ; 3) ; \mathrm{B}(1 ;-3)$ and $\mathrm{C}(0 ; 0)$ in the orthogonal plan,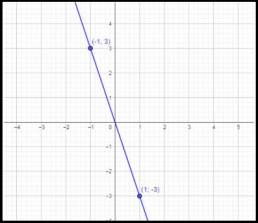
Remarque
– We have : $\mathbf{f}(\mathbf{x})=-\mathbf{3 x}$
– The points $\mathrm{A}(-1 ; 3) ; \mathrm{B}(1 ;-3)$ and $\mathrm{C}(0 ; 0)$ are aligned points,
The line ( $A B$ ) is the graphical presentation of the function $f$